11.26.2020
The October Real Estate Market In Review
Market Stats
What The October Numbers Tell Us
There’s no denying that the ongoing pandemic has impacted Toronto’s real estate market. It started with buyers sitting on the sidelines—but things started to change in July. A look at the numbers now reveals four straight months of sales growth year over year.
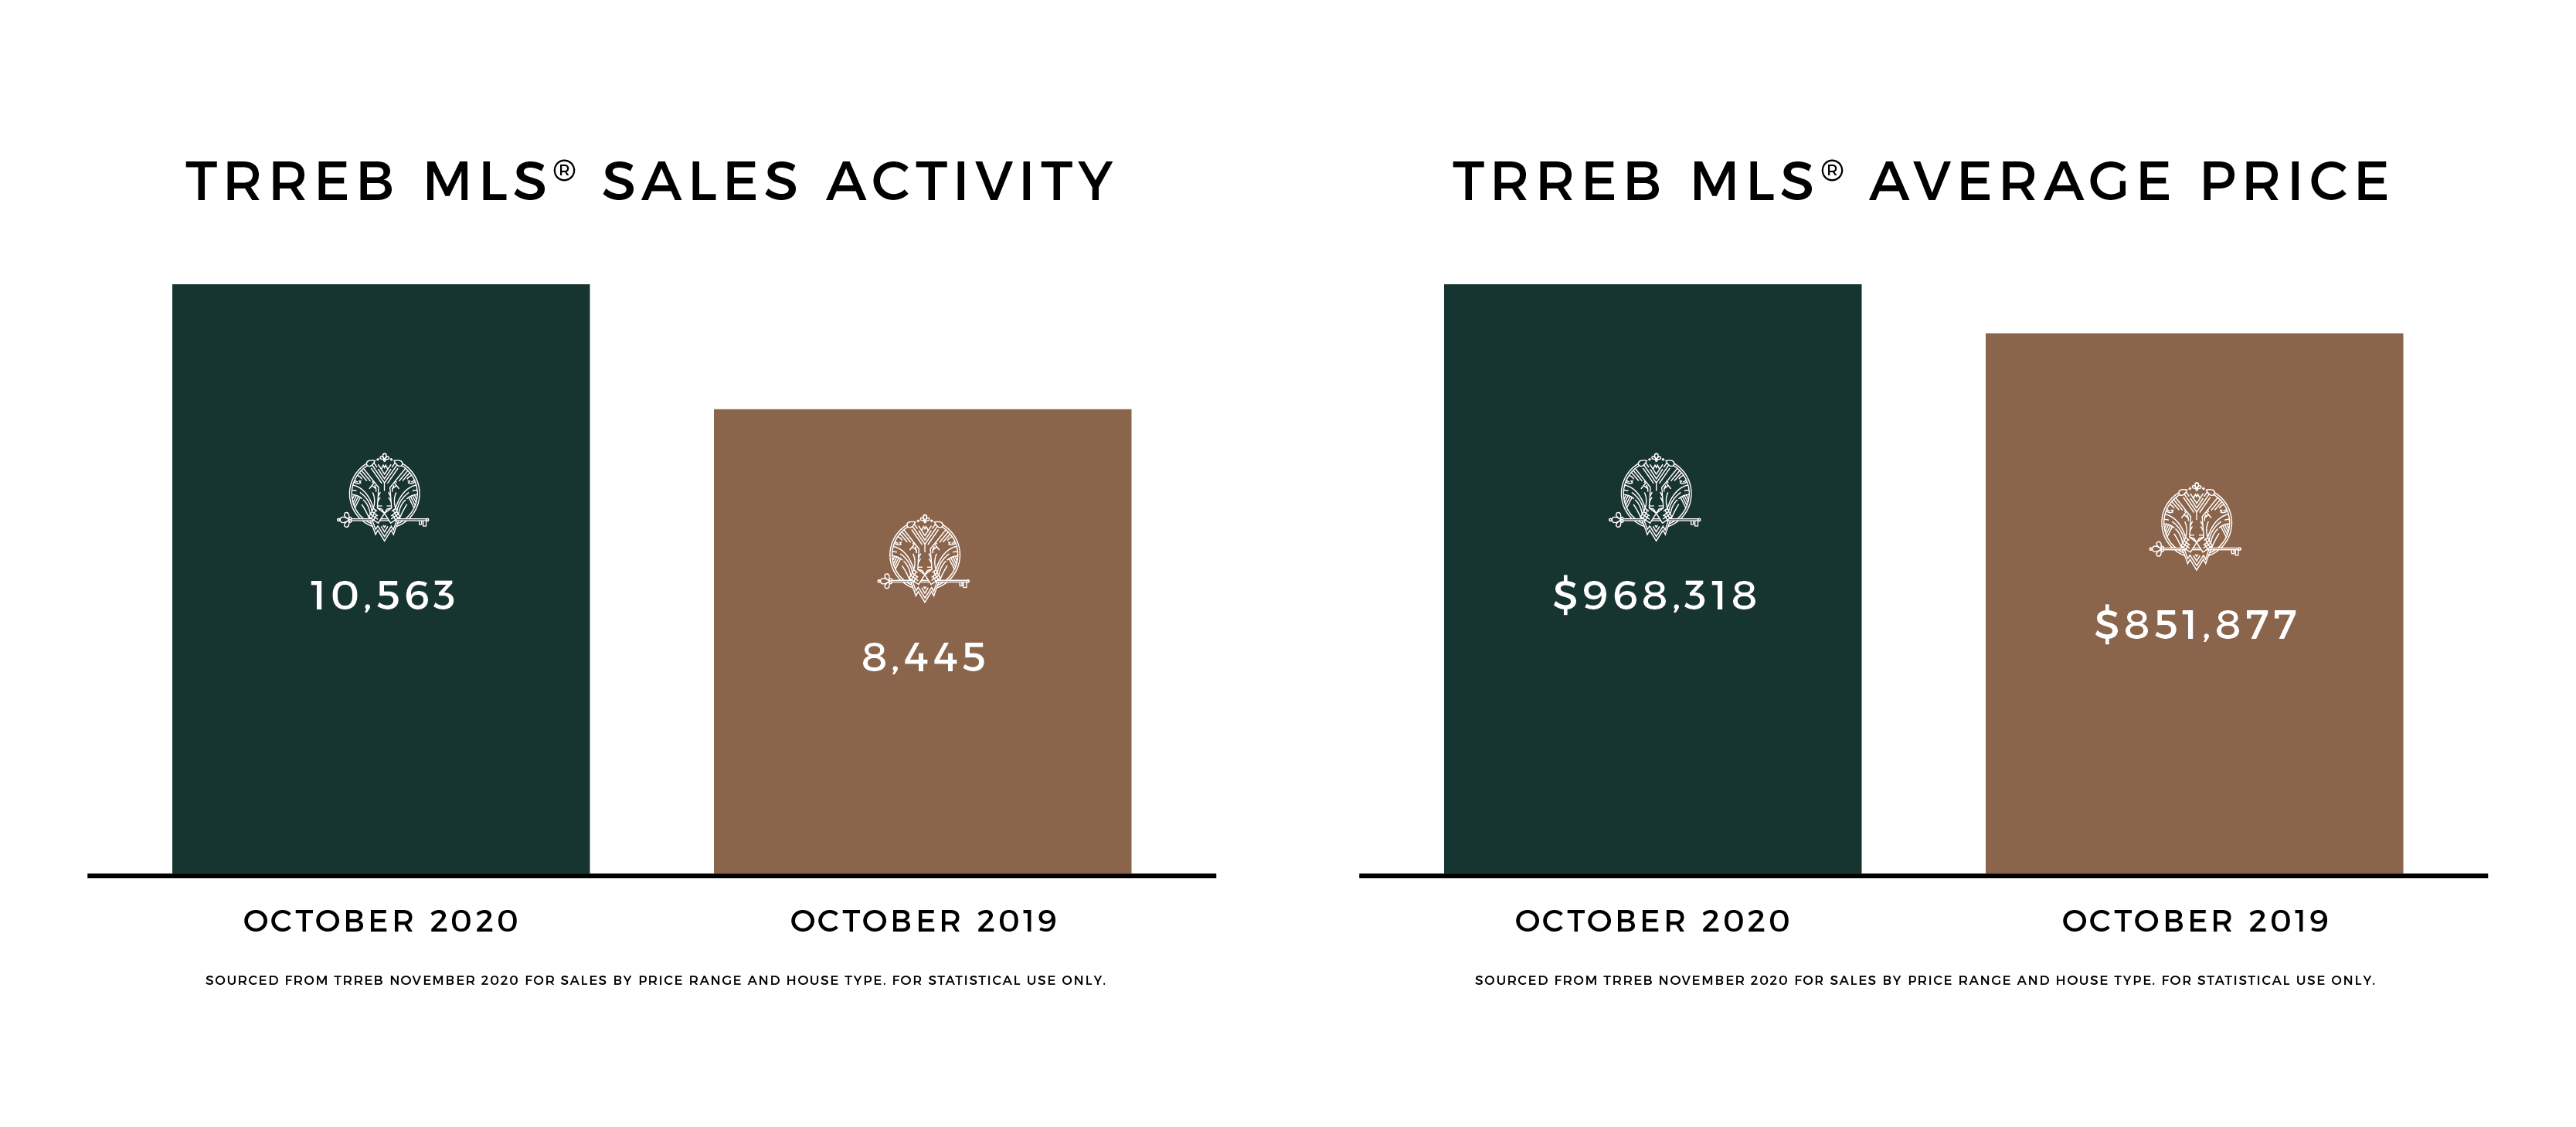
Local REALTORS® reported a total of 10,563 transactions, up by 25.1% from last October. Also impressive was the average home sale price, which jumped by 13.7% as compared to October of 2019 (reaching $968,318). Sales outstripped new listings, revealing pent up demand for homes—and competition between buyers.
This trend was strong in the detached segment, where sales were up 19.6%, and there were far more transactions than listings sitting on the market. There’s no doubt that many Torontonians will be enjoying the holidays in a new single-family home!
Of course, things looked a little different in the condo sector. As TRREB President Lisa Patel put it, “[p]re-COVID polling had already pointed to an increase in investor selling.” She noted that the pandemic has exacerbated the trend.
Having said that, condo sales were up (by a more modest 2.2%). The influx of listings compared to last October was also good news for buyers, who had more selection to choose from than usual.

Toronto’s Luxury Market: A Closer Look
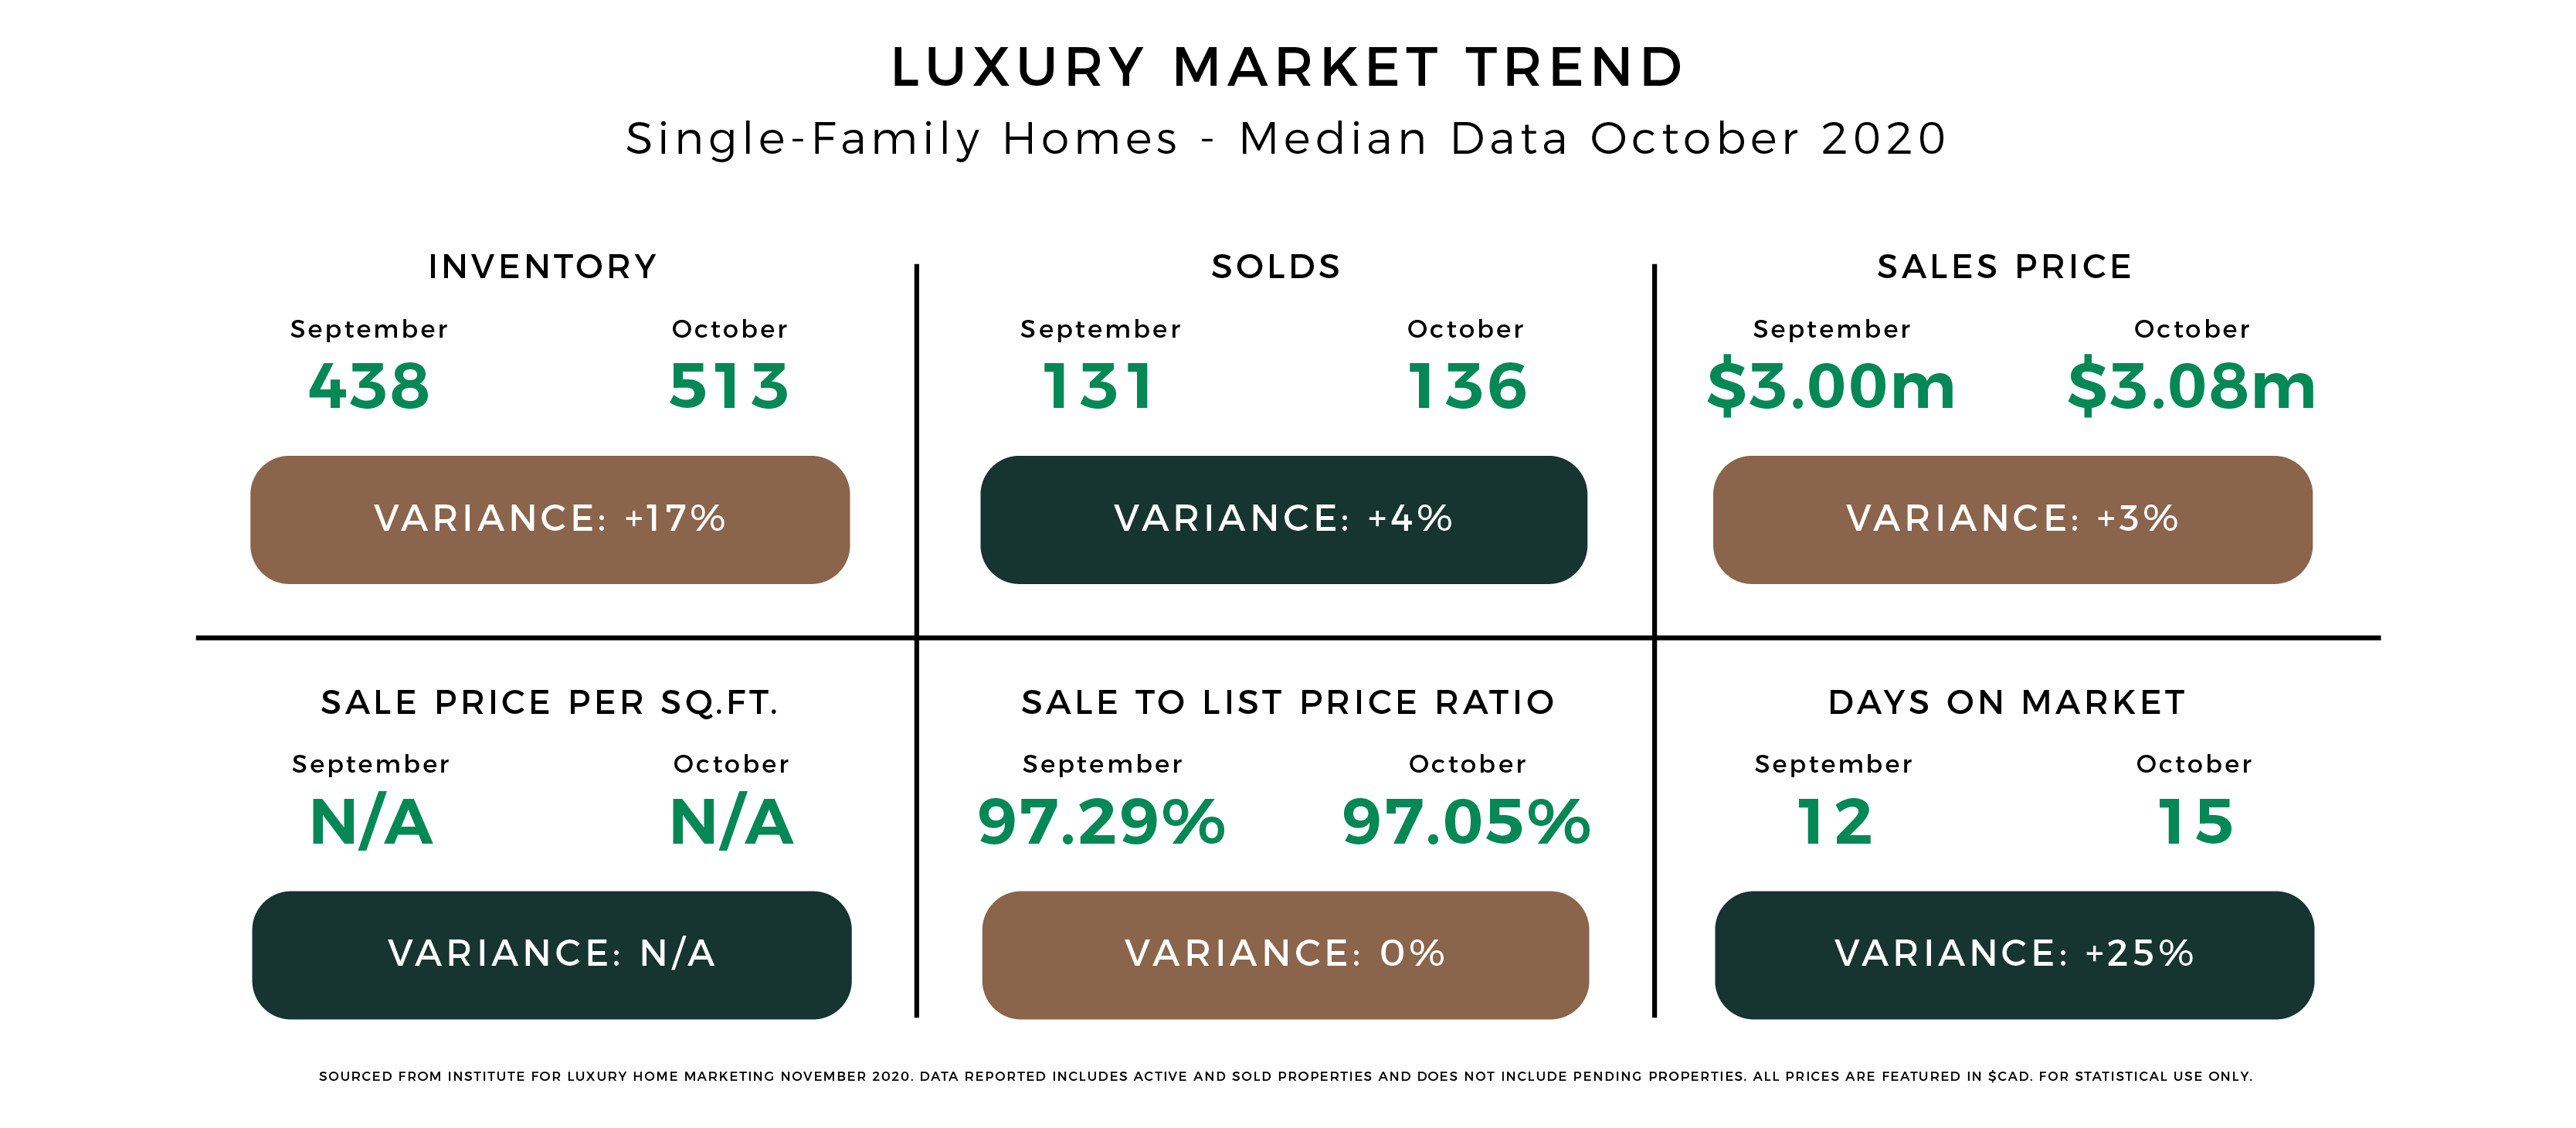
Let’s take a deeper dive and review the luxury market numbers—starting with the detached segment. The benchmark price was $2,500,000, and we saw more sales between $2,700,000 and $2,899,999 than in any other range.
The median sale to list price ratio was essentially flat month-over-month, but there were some observable market changes. To start with, the number of detached transactions were up 4% from September.
The (median) luxury detached price rose 3% in the same period, moving from $3M to $3.08M. The days on market crept up from 12 days to 15—but on the whole, what we saw was a seller’s market.
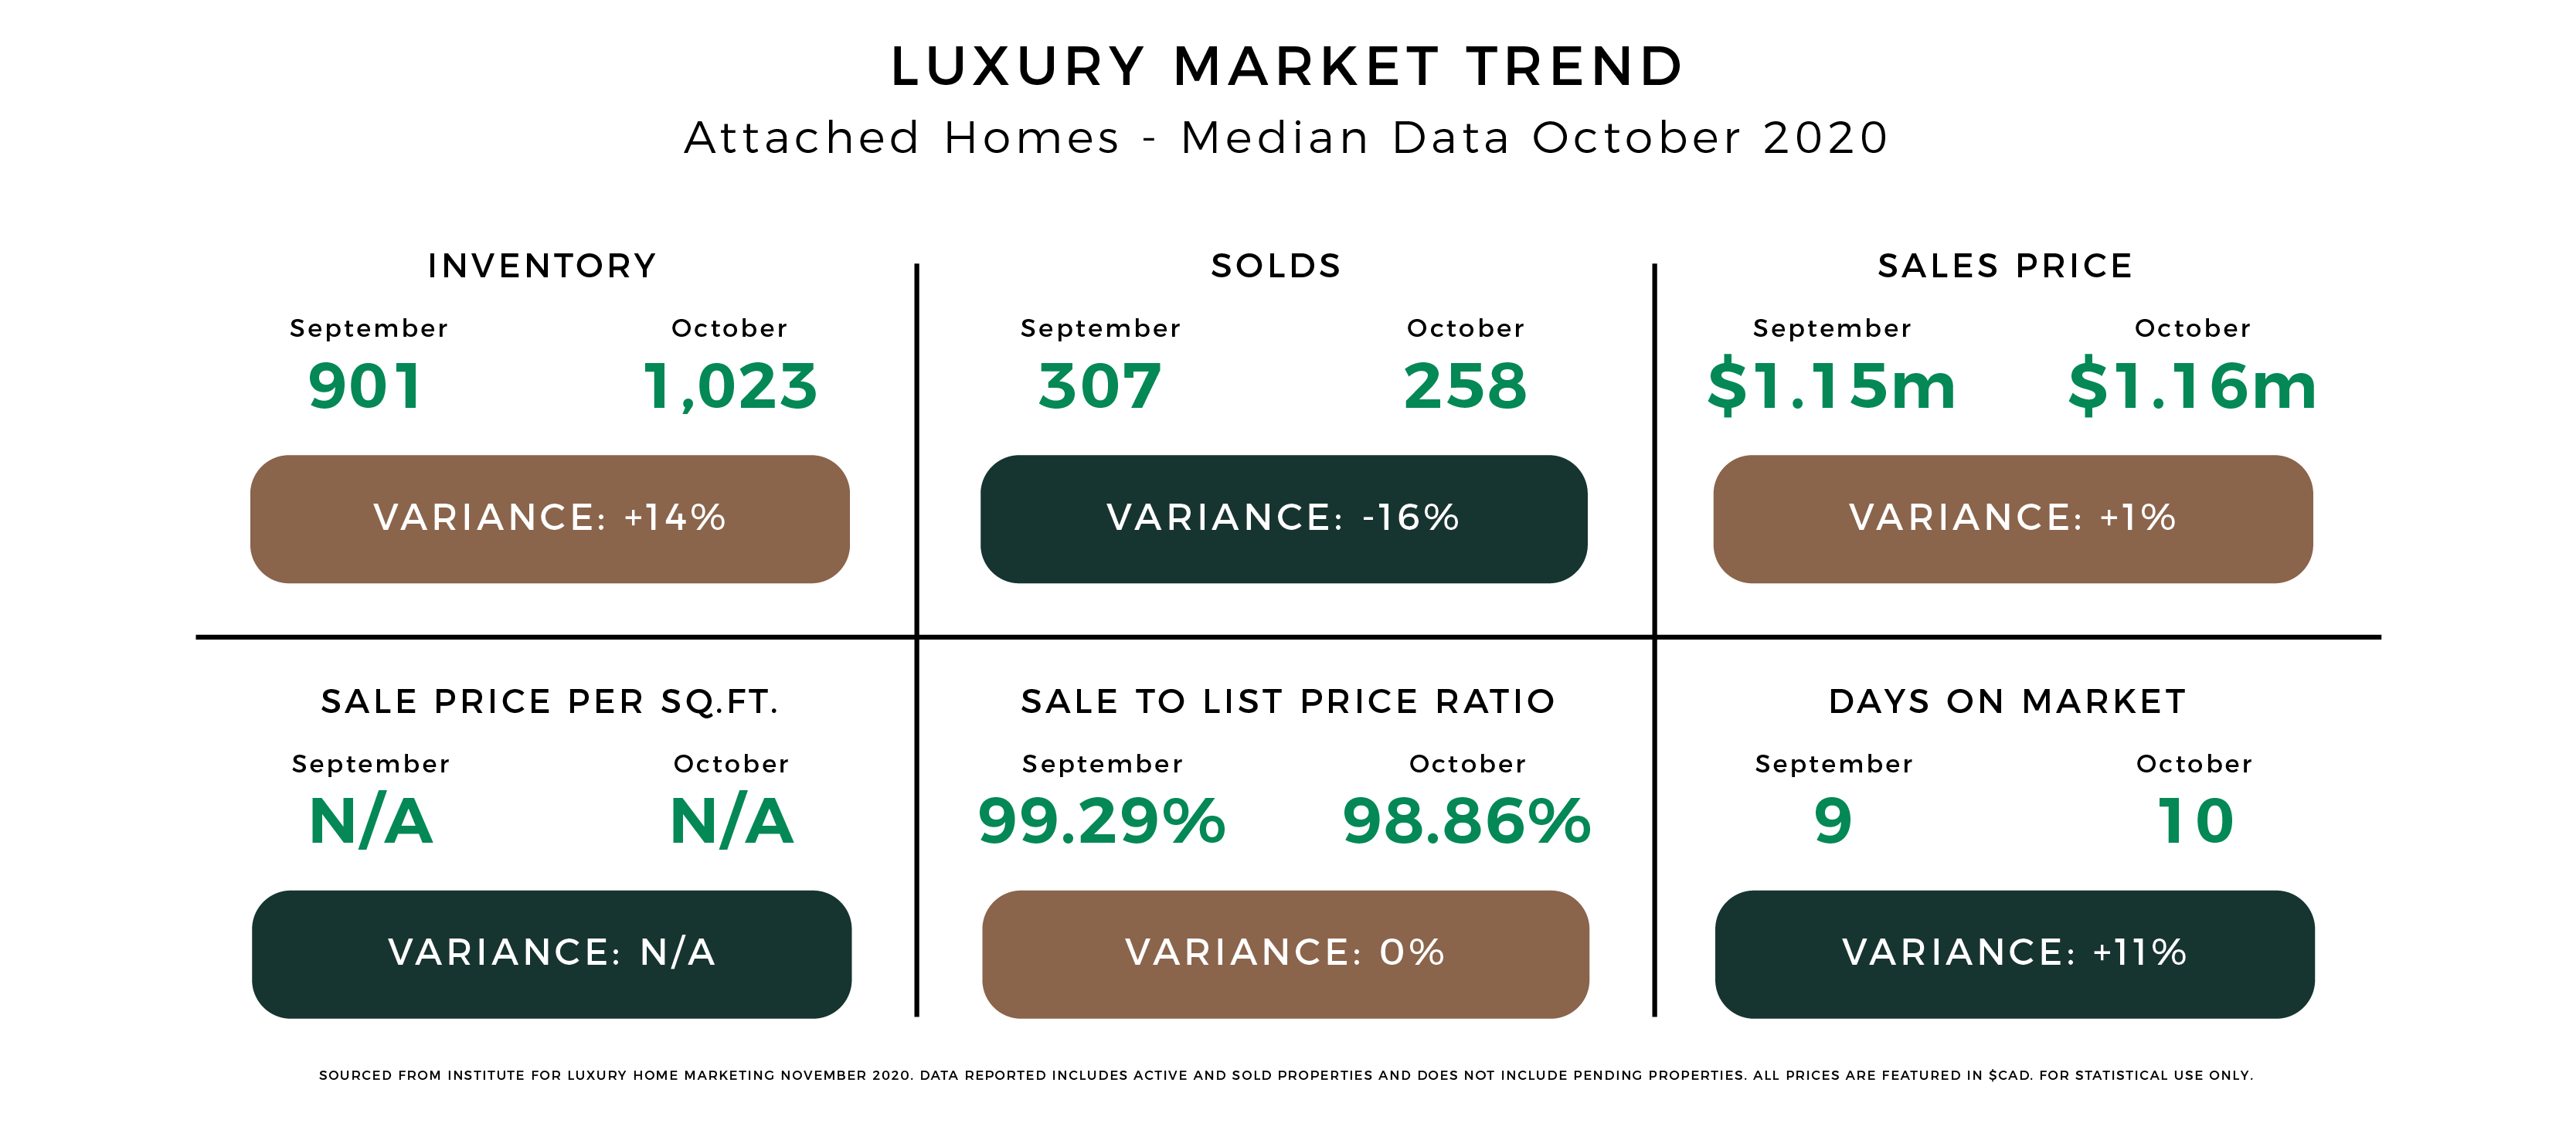
Then there was the attached segment, which told a slightly different story. The benchmark price was $915,000, and there were 258 sales. The latter number is down from last month (but once again, the 1,023 luxury attached listings reflected a real opportunity for buyers).
The average median price was up 1% month-over-month—from $1.15M to $1.16M—and the sale to list ratio remained about the same. On the whole, we’re looking at another (you guessed it) luxury seller’s market.


Ready To Make The Most Of The Market?
If you’re wondering what the latest numbers could mean for your purchase or sale, I can help. No matter your real estate goals, we can make the most of the market together. Reach out today to take the first step!


